DataAnalyzer
System measurement analysis
  • Chart all data from your connected sensors.
  • Export data to a CSV file to import into spreadsheets.
  • Add and save annotations to any alarm or data point for remarks, comments or resolutions.
  • Remotely access data and charts from any device - laptops, Tablets, iPhones and Androids.
Charting with alarm setpoints

Overlay sensor data with our advanced charting software widget. Our innovative databasing technology allows you to zoom in or out to quickly view an hour of system data or decades at once on a single display.

Charts can be customized to display individual sensor alarm setpoints and custom annotations for data points on the graph.

Export data for additional analysis
  • Export custom timeframes or entire data to CSV or tab delimited files.
  • Utilize exported data files with Spreadsheets or 3rd party analysis tools.
  • Backup sensor and annotations data to historical files for archives.
  • Import saved files to chart and review data at a future date.
Custom data point annotations

Make annotations to any measurement or alarm for recordkeeping or auditing requirements. Annotations are time stamped and permanently stored in the systems database on the systems gateway(s).

Record notes on data events and/or resolutions to correcting alarm conditions. Simply click on a data point and add your comments for permanent record.

Mobile Optimized

Access data and chart sensors on your tablet or smartphone.

Sensors and gateway hardware
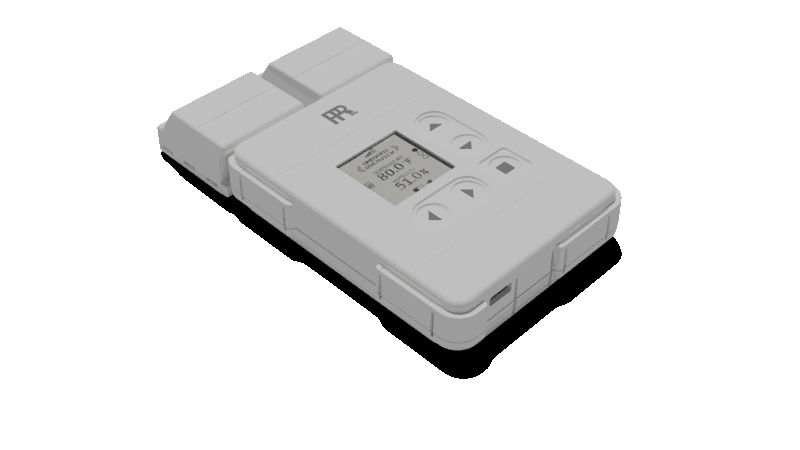
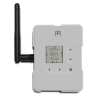
Compatible hardware and devices

DataAnalyzer software is available free with your Paragon Robotics sensors and runs on any browser enabled device. It's powerful analysis and charting tools allow further post processing analytics.

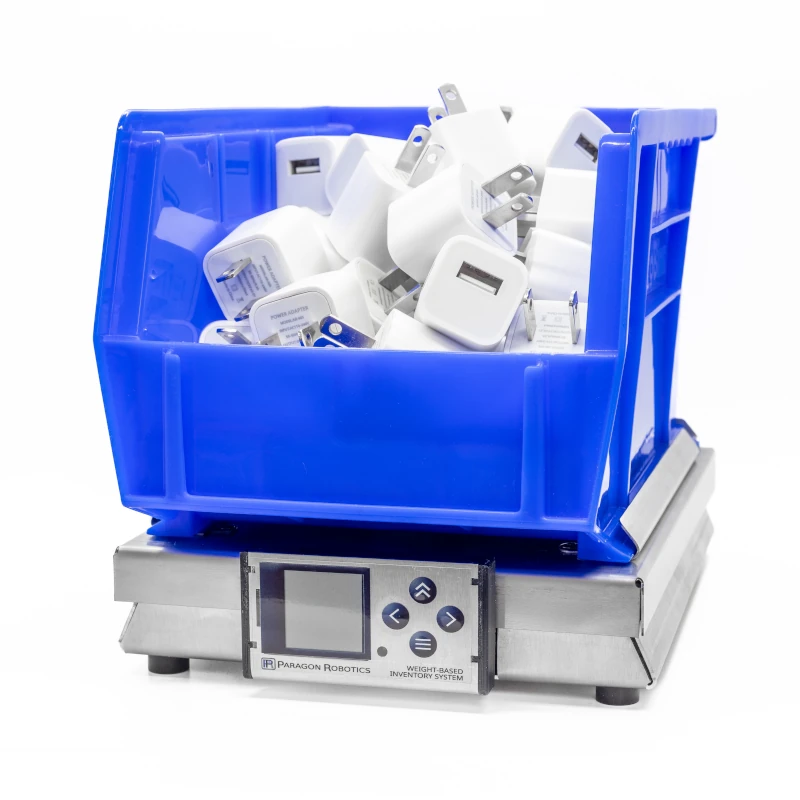
Additional sensors and controls can be added to your system. Choose from a broad range of measurements including temperature, humidity, power, light, occupancy, moisture, pressure, CO2, flow as well as compatibility with any instrumentation or sensor output.